
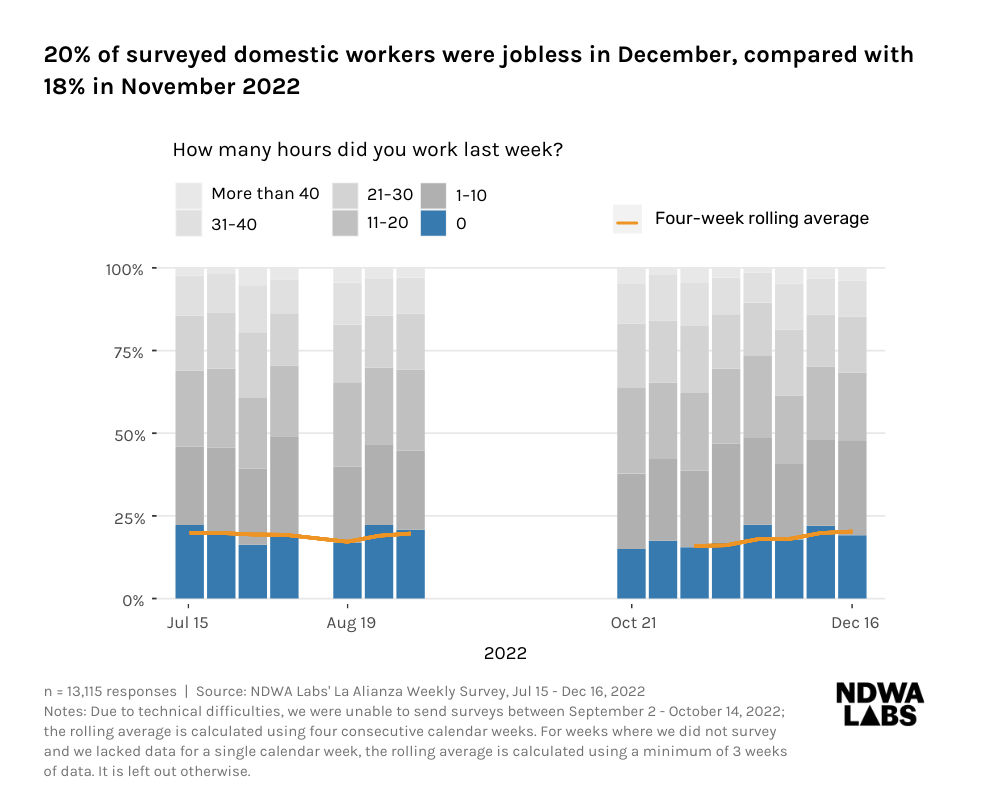
JOBLESSNESS FOR DOMESTIC WORKERS RESPONDENTS REMAINED AT 19% IN THE FOURTH QUARTER OF 2022
7 in 10 respondents who worked in December wanted more work hours
Domestic Workers Economic Situation Report · December 2022
With analysis from the fourth quarter of 2022
Source: La Alianza surveys, NDWA Labs
Released: January 10, 2023
The most recent Bureau of Labor Statistics Jobs Report shows the number of jobs added in December was above market expectations [1]. The general unemployment rate ticked down, while unemployment rates for Latina and Black women increased slightly in December 2022.
NDWA Labs’ December Report shows that the percentage of jobless domestic worker respondents in December ticked up to 20%. However, joblessness for domestic workers remained the same during the fourth quarter of 2022, compared to the third quarter, at 19%. While this is still within the lower end of joblessness rates we have seen since the pandemic began, it remains over twice the rate of 9% who reported having no jobs before COVID-19[2].
Domestic workers are the nannies, homecare workers, and house cleaners whose work is essential to our economy, and yet they are one of the most vulnerable and marginalized groups of workers. Even before COVID-19, domestic workers earned less than the average US worker and were three times as likely to be living in poverty [3].
La Alianza survey data of Spanish-speaking domestic workers shows how the pandemic has amplified the vulnerability of this workforce. Domestic workers continue to face low wages and high levels of joblessness and underemployment. A contextual note regarding our findings: domestic workers, and particularly house cleaners, often have multiple employers. This means they may have to schedule several jobs in a given week in order to make ends meet.
December Jobs Report - Bureau of Labor Statistics
Each month, the US Bureau of Labor Statistics (BLS) releases an Economic Situation Summary with employment and other labor market data. This is an important report to keep track of how the economy is doing. However, domestic workers, along with other vulnerable workers, are often underrepresented in official data. Here we present an overview of the BLS Jobs report, along with NDWA Labs’ data which shows the employment and economic situation of thousands of Spanish-speaking domestic workers.
On January 6, the BLS released new employment data for December 2022.
The number of jobs added in December was above market expectations.
The general unemployment rate ticked down.
The unemployment rate for Latina women increased slightly in December.
However, the not seasonally adjusted unemployment rate for Latina women remained unchanged.
The unemployment rate for Black women increased in December.
The unemployment rates for Black and Latinx adults continue to be higher compared to the rates for white adults.
People who have been unemployed long-term (27 weeks or more) represented 18.5% of the total unemployed in December.
Similarly, NDWA Labs’ data shows the percentage of jobless Spanish-speaking domestic worker respondents ticked up in December. While the share of joblessness for domestic workers is not directly comparable to the unemployment rate nationwide*, looking at trends in the data for Spanish-speaking domestic workers in the context of national trends can support our understanding of the sector as it relates to the broader economy.
Fourth Quarter Domestic Worker Jobs and Wages
The domestic worker joblessness rate was 19% in the fourth quarter of 2022, remaining the same as in the third quarter on average. Toward the end of the year, joblessness increased month-over-month, from 16% in October to 20% in December.
1 in 3 respondents (33%) worked more than 20 hours per week in December, roughly the same as throughout the rest of the third and fourth quarters of 2022.
Seven in ten workers were underemployed in the fourth quarter of 2022. 70% of domestic worker respondents who had at least one hour of work per week said they wanted to work more hours in the fourth quarter, compared with 69% of respondents in the third quarter.
Of the underemployed domestic worker respondents in the fourth quarter, 65% told us they were underemployed because they did not find more clients, 13% were taking care of relatives, 15% had a health issue, and 7% were underemployed for another reason.
The wage distribution remained roughly steady in the fourth quarter, relative to the third quarter. 63% of domestic worker respondents earned less than $15 per hour on average in both quarters.
Wages improved in December, with 60% of workers earning less than $15 per hour on average.
The distribution of wages in the third and fourth quarters remains improved, compared with the first half of 2022, with fewer workers making less than $15 per hour.
This share is still higher than the share of respondents who earned less than $15 per hour before COVID-19, which was at most 55%***.

Job Search
Nearly 3 in 4 respondents looked for additional work in December.
73% of domestic worker respondents, whether or not they had current work, told us they had looked for new work in the past 30 days.
Housing and Food Security
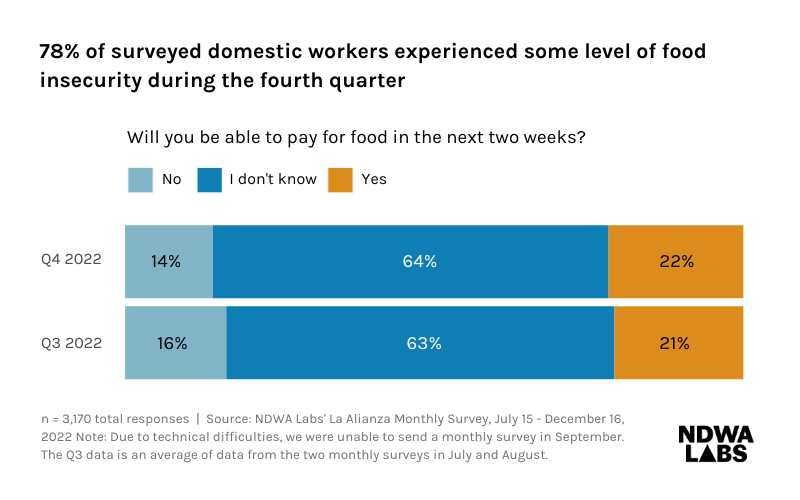
Housing insecurity decreased slightly from the third quarter to the fourth quarter of 2022. Yet more than 4 in 10 domestic worker respondents faced housing insecurity, and nearly 8 in 10 experienced food insecurity in the fourth quarter.
In the fourth quarter, 41% of domestic worker respondents said they were unable to pay their monthly rent or mortgage, compared with 42%, on average in the third quarter.
In the fourth quarter, 14% of respondents said they would not be able to afford food in the following two weeks and 64% were unsure if they would be able to.

About the surveys
NDWA Labs surveys Spanish-speaking domestic workers each week, via La Alianza, a Messenger chatbot. At the end of each survey, La Alianza provides respondents with relevant news articles and resources in Spanish. To learn more about NDWA Labs’ La Alianza survey of Spanish-speaking domestic workers, see this report.
The employment numbers presented in this report include data from all of our weekly surveys from July through December 2022. Due to technical difficulties, we were unable to send surveys between September 2 and October 14. The last survey of 2022 was sent on December 16, due to NDWA Labs’ Winter office closure.
Third quarter averages represent data from 7 weekly surveys fielded between July 15 and September 2, 2022. Fourth quarter averages represent data from 8 weekly surveys fielded between October 21 and December 16, 2022.
The total number of fully completed surveys for our December weekly surveys, which includes both new and repeated respondents, was 1,744; for November weekly surveys, we had 2,040 completed surveys; for October, we had 1,450 completed surveys; for August, we had 1,799 completed surveys; and for July, we had 1,743 completed weekly surveys.
Questions about hours worked and hourly wages are asked weekly, questions regarding underemployment and job search are asked bi-weekly, and questions around food and housing security are asked monthly.
La Alianza is a product of NDWA Labs, the innovation partner of the National Domestic Workers Alliance. NDWA Labs experiments with the ways technology can organize domestic workers and transform domestic work jobs into good jobs by bringing respect, living wages, and benefits to an undervalued and vulnerable part of the economy.
For questions, please contact us here.
Notes
1 White House Council of Economic Advisers (2022), The Employment Situation in November
2 NDWA Labs (2020), 6 Months in Crisis: The Impact of COVID-19 on Domestic Workers
3 Economic Policy Institute (2022), Domestic Workers Chartbook
* Unlike unemployment rates, joblessness for domestic workers may include people who are not working but are currently unavailable to work, or not actively looking for jobs. Additionally, the NDWA Labs’ joblessness rate for surveyed domestic workers is NOT seasonally adjusted, while BLS unemployment rates are adjusted.
** Due to technical difficulties, we were unable to survey between September 2-October 14, 2022. Due to this gap, we are unable to show averages for the full third quarter of 2022.
*** The share of respondents earning less than $15 in 2022 cannot be directly compared to baseline numbers before COVID-19, due to a change in answer option ranges (see above footnote). However, since 55% of respondents reported earning $15 or less before COVID-19,2 a share which is inclusive of those who earned $15 per hour, we know that the share of respondents earning less than $15 is at most 55%.